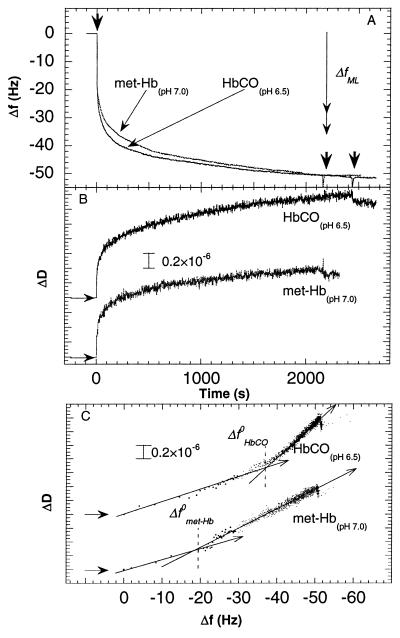
Figure 1.
Changes in frequency (A) and dissipation (B) as a function of time during adsorption of met-Hb and HbCO at pH 7.0 and 6.5, respectively, to gold covered by a hydrophobic methyl-terminated-thiol monolayer (10 mM Hepes). The proteins were introduced at t = 0. The two right arrows in A indicate the times at which the two protein solutions were exchanged for pure buffer solutions. The vertical double arrow in A shows the predicted frequency change for a monolayer of Hb. Two limiting values are given (29 Hz < ΔfML < 35 Hz) depending on the orientation of the Hb molecules on the surface (see text). (C) D-f plots using the data from A and B. Note that the density of data points (equispaced in time) becomes smaller the faster the kinetics, in this type of plot. This explains the small number of data points near the origin, where the kinetics is fast. The horizontal arrows in B and C denote the starting points of the experiments, i.e., ΔD = Δf = t = 0. The arrows drawn through the D-f graphs in C indicate the direction of time. Δf 0 denotes the break-point of the D-f graph into two regimes.

