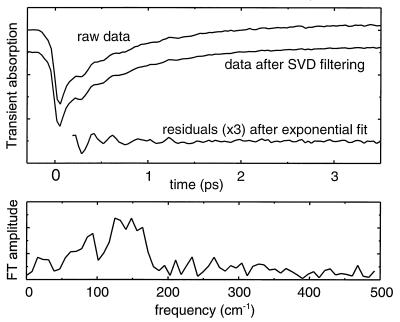
Figure 2.
Example of the data processing. The transient A at 935 nm of the HL168L RC was chosen as sample data. (Upper) The upper curve shows the raw data. Removing uncorrelated noise by singular value decomposition filtering gives the middle curve. To extract the oscillations, the filtered data were fitted to a biexponential decay (not shown). The residuals (data minus fit) are shown in the lower curve; the FT of this curve gives the frequency spectrum shown in the Lower panel.

