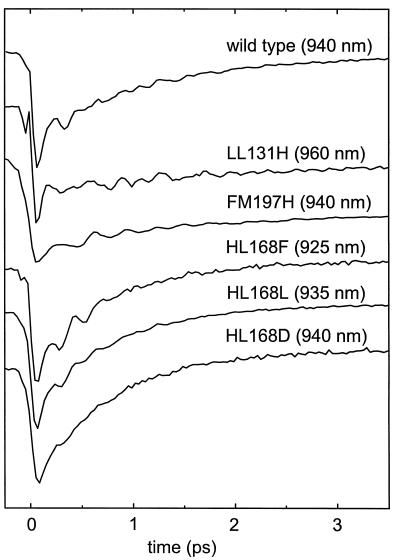
Figure 3.
Transient absorption data. The plot shows kinetic data for wt RC and for the single site mutants at selected wavelengths at the red side of the stimulated emission band (cf. ref. 2) that display typical decay times and magnitudes of the oscillatory features.

