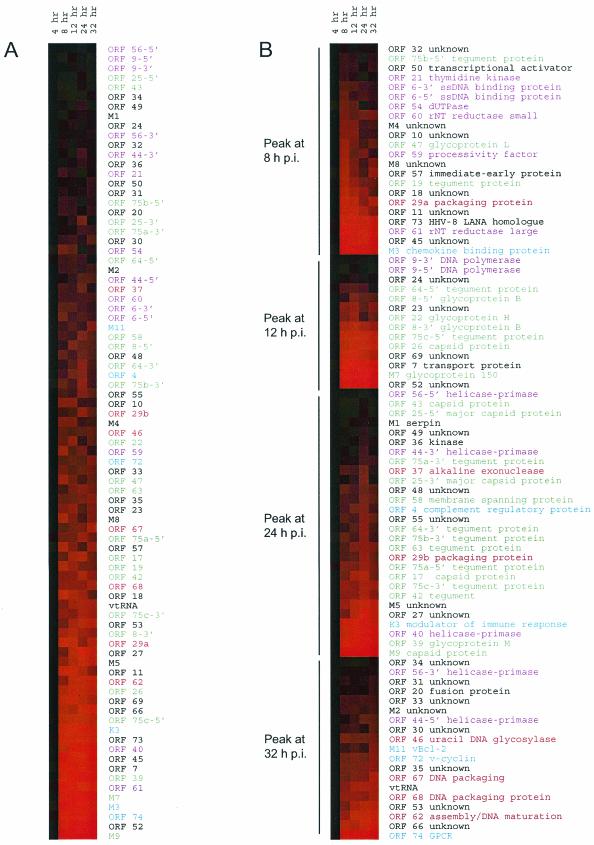
FIG.2.
Lytic gene expression profile. RNA samples from a time course postinfection of BHK-21 cells were analyzed by membrane array analysis. The data are graphically displayed with color to represent the quantitative changes in RNA abundance. Increases of RNA are shown as deeper shades of red. ORFs are color coded based on functional groups, with purple corresponding to nucleotide synthesis and DNA replication proteins, green corresponding to structural proteins, red corresponding to assembly proteins, blue corresponding to homologues of cellular signaling proteins, and black corresponding to unknown or other proteins. (A) The genes were sorted based on the overall abundance level throughout the course of the experiment. (B) The genes were ordered based on the time at which peak expression is reached and then sorted based on the relative abundance level at the peak of expression. The data are graphically displayed with color to represent the quantitative changes in RNA abundance. Increases of RNA are shown as deeper shades of red. M9, ORF 65.

