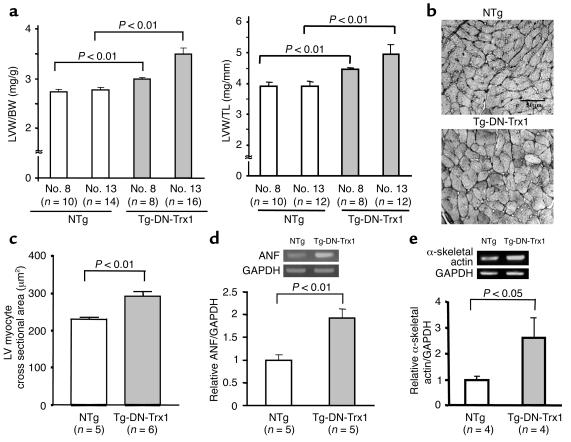
Figure 3.
(a) LVW/BW (mg/g; left) and LVW/TL (mg/mm; right) were determined in Tg-DN-Trx1 mice (line nos. 8 and 13) and NTg littermates. The age of the animals was 85 ± 3 days in Tg-DN-Trx1 line no. 8, 81 ± 4 days in Tg-DN-Trx1 line no. 13, 84 ± 4 days in NTg line no. 8, and 79 ± 5 days in NTg line no. 13. (b) Silver staining of LV myocardial sections, showing LV myocyte cross-sectional area in Tg-DN-Trx1 mice and NTg littermates. (c) Mean LV myocyte cross-sectional area was determined from 100–200 myocytes in each animal. The experiments were conducted using five NTg and six Tg-DN-Trx1 mice. (d and e) mRNA expression of ANF (d), α-skeletal actin (e), and GAPDH was determined by RT-PCR. The intensity of the ethidium bromide bands was quantitated. The intensity of ANF or α-skeletal actin bands was normalized by that of GAPDH bands.

