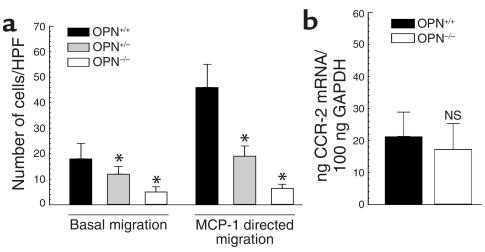
Figure 7.
Transwell migration and CCR-2 expression of OPN+/+ and OPN–/– leukocytes. (a) Peritoneal leukocytes from OPN+/+ and OPN–/– mice were harvested 3 days after thioglycollate injection and subjected to chemotaxis assays in modified Boyden chambers. Basal migration and MCP-1–directed migration (50 ng/ml) was determined and expressed as cell number counted per HPF (×320). Experiments were repeated three times in duplicate. Data are expressed as mean ± SEM, *P < 0.05 versus OPN+/+ leukocytes. (b) CCR-2 mRNA expression was analyzed by quantitative real-time RT-PCR and normalized to GAPDH mRNA expression (n = 4 in each group). Data are represented as the average mean ± SEM.

