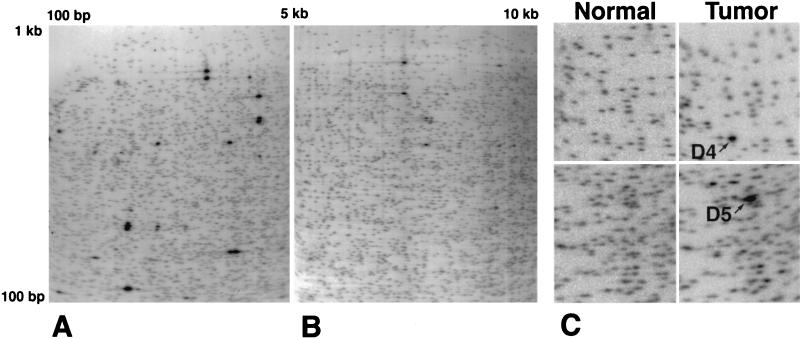
Figure 1.
2D DNA electrophoresis gels from esophageal squamous epithelium of NotI–EcoRV fragments 100–5,000 bp in size (A) and NotI–EcoRV fragments 5,000–10,000 bp in size (B). In normal controls, spots of increased intensity as compared with the intensity of spots from two-copy fragments represent multiple copy ribosomal DNA fragments. This technique allows analysis of over 6,000 genomic fragments. (C) Enlargement of a portion of two regions of larger fragment images comparing spot patterns from normal control tissue and esophageal adenocarcinoma DNA from the same patient. The fragments labeled D4 and D5 demonstrate an ≈20-fold amplification in the tumor and were subsequently extracted from a preparative gel and cloned.

