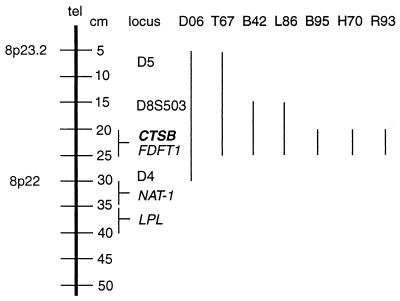
Figure 4.
Summary of Southern blot data demonstrating amplification of 8p loci in esophageal adenocarcinomas. Bars at right indicate the loci amplified in the seven tumors studied with all probes. Mapping data for CTSB, FDFT1, LPL, NAT-1, and D8S503 were taken from the human chromosome 8 Gene Map of the National Center for Biotechnology Information (http://www.ncbi.nih.gov/genemap). The D4 locus was mapped by FISH and by radiation hybrid panel analysis to 29 cM. The D5 locus was mapped by FISH to 8p23.2.

