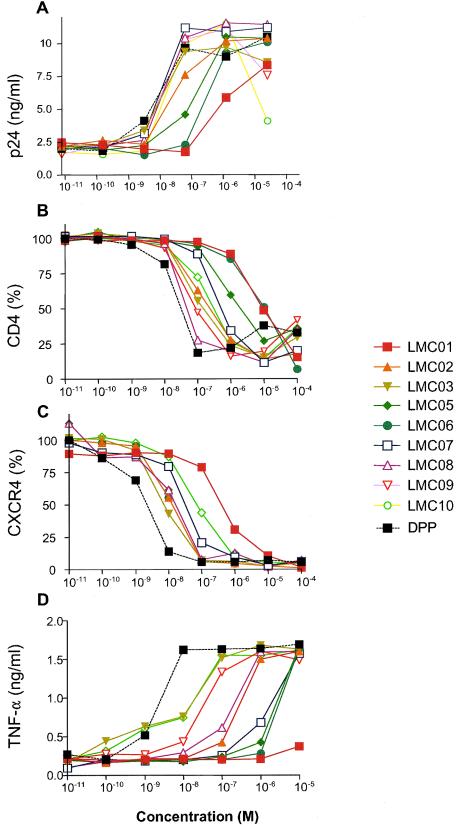
FIG. 2.
Biological activities of DAG compounds compared to that of DPP. (A) ACH-2 cells were grown in the presence of various concentrations of the indicated compounds for 48 h, and p24 antigen production was measured by ELISA. (B) ACH-2 cells were grown in the presence of various concentrations of the indicated compounds for 16 h, and cell surface CD4 expression was measured by antibody staining and fluorescence-activated cell sorting; results were normalized to 100% for no added compound. (C) ACH-2 cells were grown in the presence of various concentrations of the indicated compounds for 16 h, and cell surface CXCR4 expression was measured by antibody staining and fluorescence-activated cell sorting; results were normalized to 100% for no added compound. (D) PBMC were grown in the presence of various concentrations of the indicated compounds for 18 h, and TNF-α secretion was measured by ELISA.

