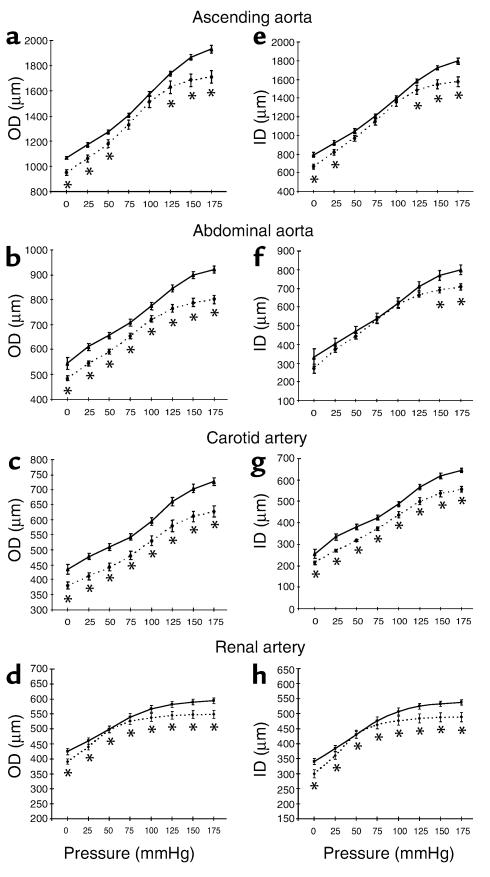
Figure 1.
Pressure-diameter relationships for segments of arteries from Eln+/+ and Eln+/– mice. Pressure-OD curve in the ascending aorta (a), in the abdominal aorta (b), in the carotid artery (c), and in the renal artery (d). Pressure-ID curve in the ascending aorta (e), in the abdominal aorta (f), in the carotid artery (g), and in the renal artery (h). *Significant difference (P ≤ 0.05, LSD test) between Eln+/+ and Eln+/– vessel diameters at the corresponding pressure. Mean values ± SEM, n = 4–8 for each vessel type. Solid lines, Eln+/+; dotted lines, Eln+/–.

