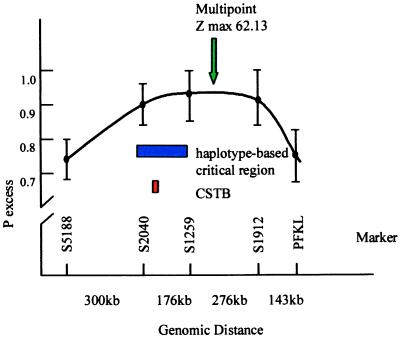
Figure 3.
Diagram of the CSTB region on chromosome 21q. The x-axis shows the location and physical distances (in kb) between five polymorphic markers. • indicate the degree of linkage disequilibrium (expressed as pexcess) calculated between EPM1 and the marker. Before CSTB was found (its location is shown in red), a minimal critical region (shown in blue) was defined based on the analysis of historical recombinations in the haplotypes of 88 EPM1-carrying chromosomes. The green arrow shows the point of highest multipoint linkage disequilibrium (z = 62.13) using these markers.

