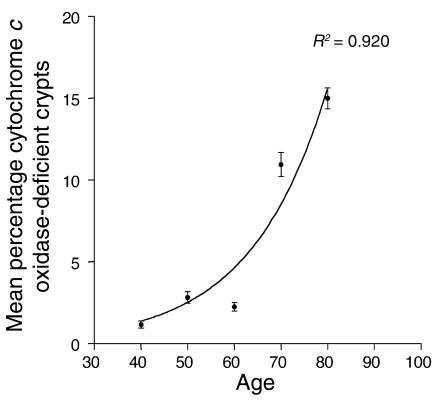
Figure 5.
Incidence of cytochrome c oxidase–deficient colonic crypts per decade. Only crypts in which at least 50% of all cells were cytochrome c oxidase deficient were included. The crypts were counted on at least ten different transverse sections for 28 individual patients. The average value for each patient was included in the mean ± SEM value given for each decade. The number of patients per decade was 35–44 years, four patients; 45–54 years, seven patients; 55–64 years, five patients; 65–74 years, six patients; 75–84 years, six patients. (See also Table 2.) R2 is a measure of the conformation to an exponential increase where 0 represents no association and 1 is a perfect fit.

