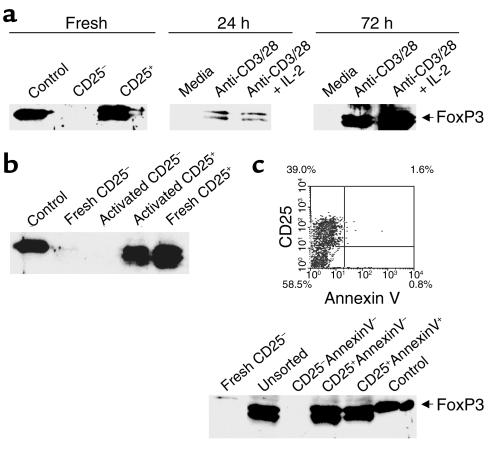
Figure 2.
Activation of human CD4+CD25– T cells induces FoxP3 expression. Western blot analysis of FoxP3 expression in (a) freshly isolated, purified CD4+, CD4+CD25+, and CD4+CD25– T cells or CD4+CD25– T cells that have or have not (media) been activated with plate-bound anti-CD3/soluble anti-CD28 (anti-CD3/28) for 24 or 72 hours in the presence or absence of IL-2, (b) freshly isolated CD4+CD25– or CD4+CD25+ and activated CD4+CD25– PBMCs after sorting into CD4+CD25– and CD4+CD25+ T cells. (c) FACS plot showing percentage of cells in each population before sorting. Western blot analysis of FoxP3 expression in freshly isolated CD4+CD25– T cells or activated CD4+CD25– T cells either unsorted or sorted for CD25 and Annexin V staining. Cells were also gated and sorted on live cells by FCS versus SSC. Control cells were 293T cells transfected with a human FoxP3 cDNA clone. Parts a and b show results from one experiment but are representative of four separate experiments. Figure 2c shows results from one experiment.

