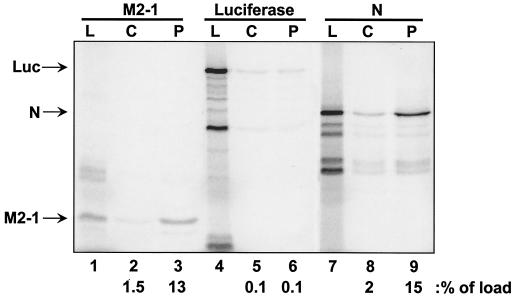
FIG. 2.
P-affinity chromatography with IVT expressed M2-1, luciferase, and N proteins. Columns containing immobilized P protein or control columns containing no immobilized protein were loaded with IVT protein lysates containing either M2-1 (lanes 1 to 3), luciferase (lanes 4 to 6), or N (lanes 7 to 9) proteins. Lanes: L, load (5 μl per lane); C, high-salt eluate from control column; P, high-salt eluate from P columns (10 μl per lane). The positions of M2-1, luciferase (Luc), and N are indicated to the left of the gel. The amount of each protein present in the high-salt elution fractions from each column and normalized to the load fraction (100%) is indicated at the bottom of the figure (as a percentage of load).

