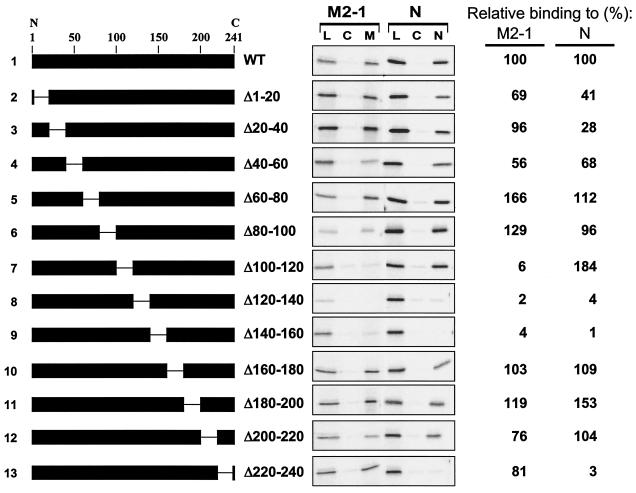
FIG. 4.
Analysis of P deletion mutants by M2-1 and N-affinity chromatography. (Left) Schematic representations of P deletion mutants used to program IVT protein lysates loaded onto M2-1 and N columns. The numbers above line 1 give the positions of amino acid residues in the P protein (from the N to C terminus, as indicated). The gap in the black rectangle represents the region deleted in each protein. The amino acid residues that flank the deleted residues in each protein are indicated to the right of the schematic representation. (Center) M2-1 and N-affinity chromatography, as described in the legend to Fig. 1, except that each column was eluted only with a high level of salt (50 μl). Lanes: L, 1 μl of the load material that was applied to each column; C, high-salt eluate from control column (10 μl per lane); M and N, high-salt eluates from M2-1 and N column, respectively (10 μl per lane). (Right) The M2-1- and N-binding activity of each mutant, relative to the WT (set at 100%), as determined by quantification of the gels in the center panel, is shown.

