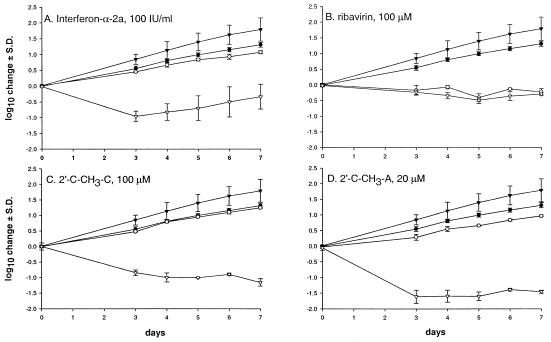
FIG. 2.
Dynamics of cell growth and HCV RNA levels after exposure to control anti-HCV compounds. HCV replicon cells were seeded at approximately 104 cells per well in a 24-well plate. Over a 7-day period, cells were counted daily, and rRNA and HCV RNA were quantified by quantitative reverse transcription-PCR. (A) IFN-α-2a at 100 IU/ml. (B) Ribavirin at 100 μM. (C) 2′-C-CH3-C at 100 μM. (D) 2′-C-CH3-A at 20 μM. •, cell proliferation in the absence of the compound; ○, cell proliferation in the presence of the compound; ▾, HCV RNA levels in untreated cells; ▿, HCV RNA levels in the presence of the compound. The points shown are averages ± standard deviations (S.D.) (error bars) for three independent experiments.

