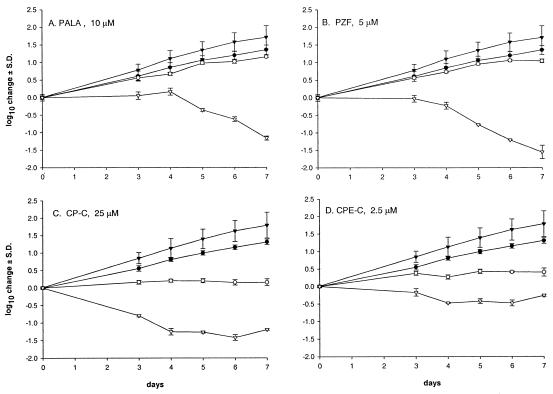
FIG. 3.
Dynamics of the cell growth and HCV RNA levels after exposure to selected antimetabolites. The experimental method used is described in the legend to Fig. 2. (A) PALA at 10 μM. (B) PZF at 5 μM. (C) CP-C at 25 μM. (D) CPE-C at 2.5 μM. •, cell proliferation in the absence of the compound; ○, cell proliferation in the presence of the compound; ▾, HCV RNA levels in untreated cells; ▿, HCV RNA levels in the presence of the compound. The points are averages ± standard deviations (S.D.) (error bars) for three independent experiments.

