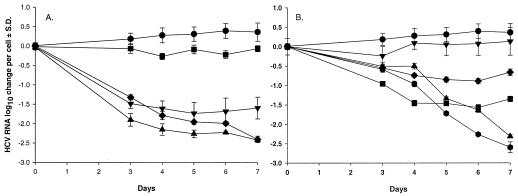
FIG. 4.
Replicon RNA changes per cell. The plots were obtained from collected data as shown in Fig. 2 and 3, in which log10 changes for cell count and replicon RNA levels were subtracted from each other. (A) Control antiviral compounds. •, no drug control; ▾, IFN-α-2a at 100 IU/ml; ▪, ribavirin at 100 μM; ⧫, 2′-C-CH3-C at 100 μM; ▴, 2′-C-CH3-A at 20 μM. (B) Selection of the most important antimetabolites. •, no drug control; ▾, dFdC at 50 nM; ▪, CP-C at 25 μM; ⧫, CPE-C at 2.5 μM; ▴, PALA at 10 μM; , PZF at 5 μM.

