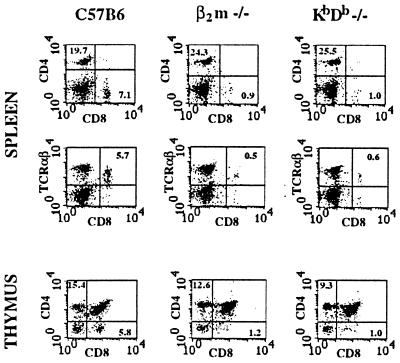
Figure 3.
Reduction in CD8+TCRαβ T cell numbers in KbDb −/− mice. FACS analysis was performed on C57BL/6, β2m −/−, or KbDb −/− splenocytes (Top and Middle) or thymocytes (Bottom) with α-CD8-FITC, α-CD4-PE, and α-TCRαβ-PE antibodies, as indicated. Numbers correspond to percentage of cells in the indicated regions.

