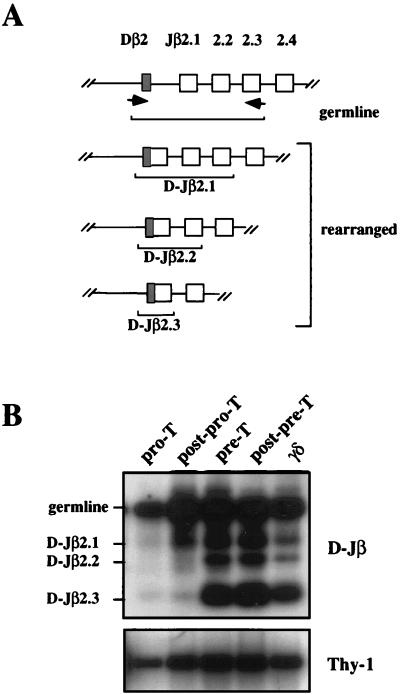
Figure 3.
Analysis of TCR D-Jβ rearrangements during early thymic development. (A) Schematic representation of the PCR assay. The position of the primers as well as the different fragments amplified are shown. (B) Represents a long exposure of the blot obtained as described in experimental procedures after applying the assay described in A on DNA purified from the different early thymic subsets.

