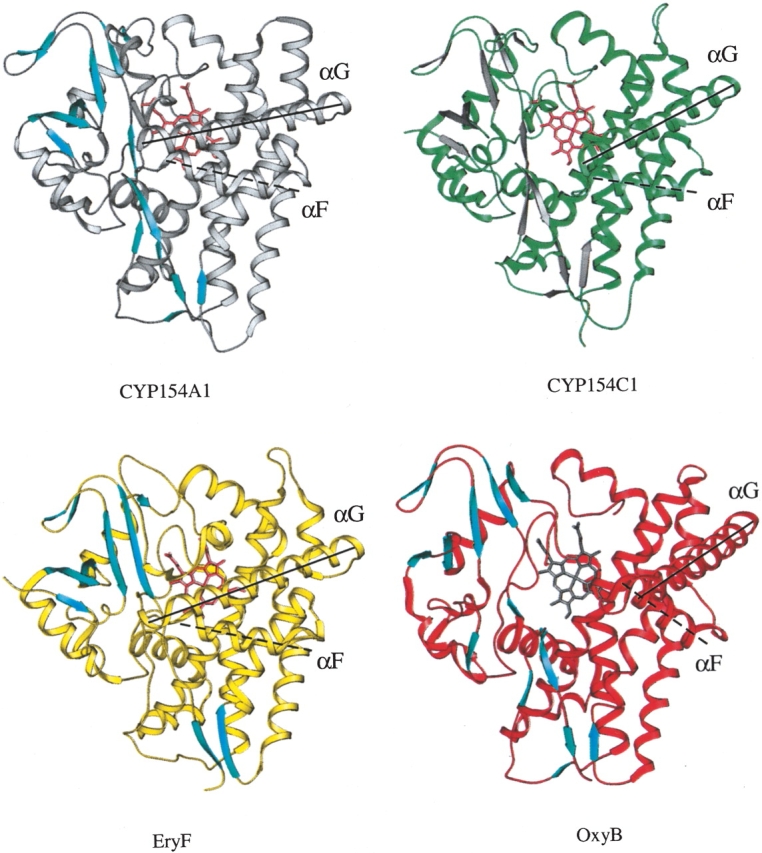
Figure 8.

Ribbon representation of CYP154A1, CYP154C1, EryF, and OxyB structures. Positions of the G and F helices are emphasized by solid (G) and dashed (F) lines running along the helical axis. All four structures are in the same orientation. β-Strands are shown in colors contrasting with the rest of the structure.
