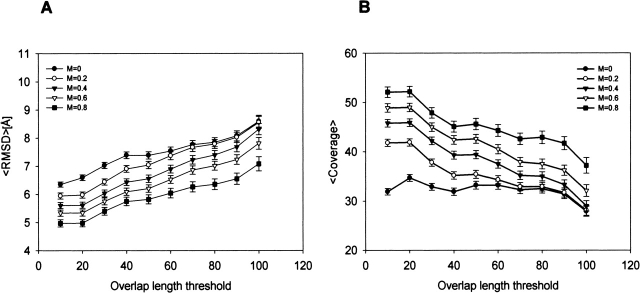
Figure 6.
Average alignment accuracy of the top five alignments selected by E-value as a function of the thresholds on the overlap length (x-axis) and the ISSnew score (M). The E-values were calculated using the BLOSUM62 amino acid substitution matrix. (See Figure 4 ▶ for details.)

