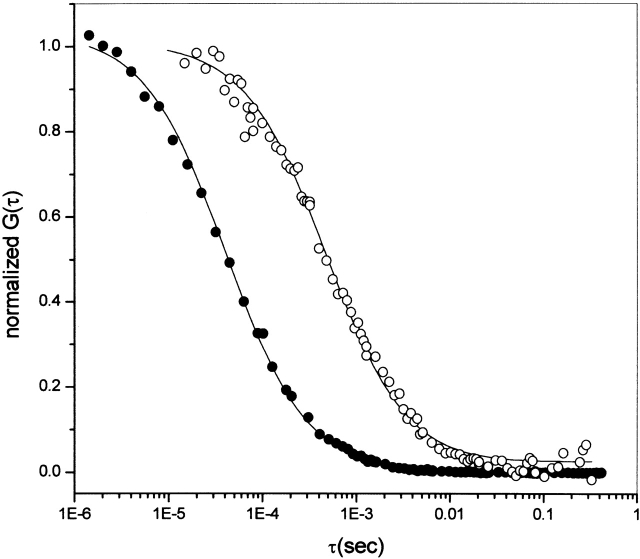
Figure 3.
Normalized autocorrelation curve G(τ). Normalized autocorrelation for data taken at 100 kHz for fluorescein (•) and Alexa-labeled tubulin (○). Curved lines correspond to the best fit parameters. G(0) values have been normalized, and the instrument was calibrated with fluorescein using a diffusion coefficient of 300 μm2/sec. The Alexa-tubulin data were best fit to a diffusion coefficient of 54 μm2/sec.

