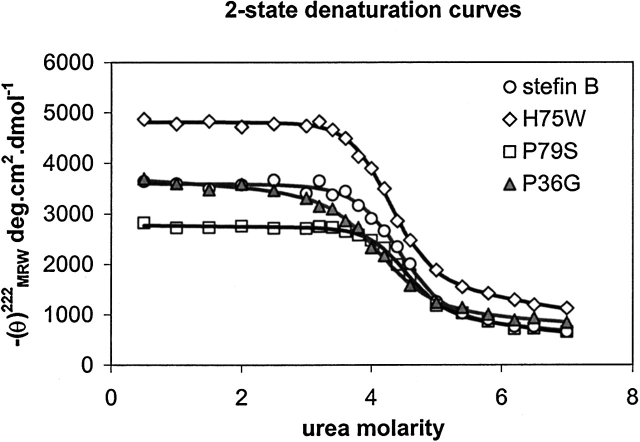
Figure 4.
Urea denaturation curves of the recombinant human stefin B and the site-specific mutants: P79S, P36G, and H75W. Protein concentration was 34 μM. The CD data at 222 nm were measured at 25°C after equilibration for at least 16 h. Calculated curves were fit to a two-state transition, according to Santoro and Bolen (1988).

