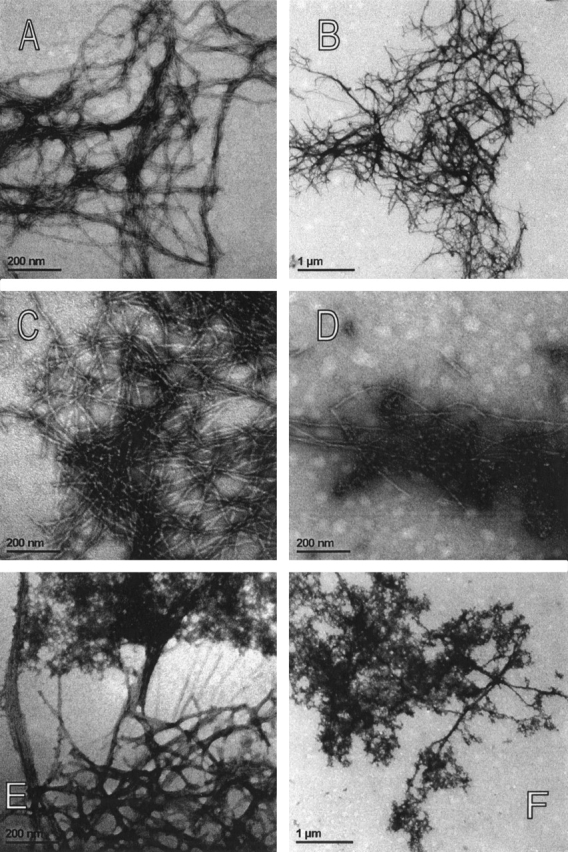
Figure 7.

(A–F) TEM images of the amyloid-fibrils and the amorphous aggregates. Protein concentration was 34 μM. (A,B) Recombinant human stefin B at lower and higher magnification. (C,D) P79S variant. (C) P79S amyloid fibrils and (D) granular aggregates. (E,F) P36G variant. (E) Extension of amorphous aggregate into smeared fibrils. (F) Amorphous aggregates.
