
Figure 2.
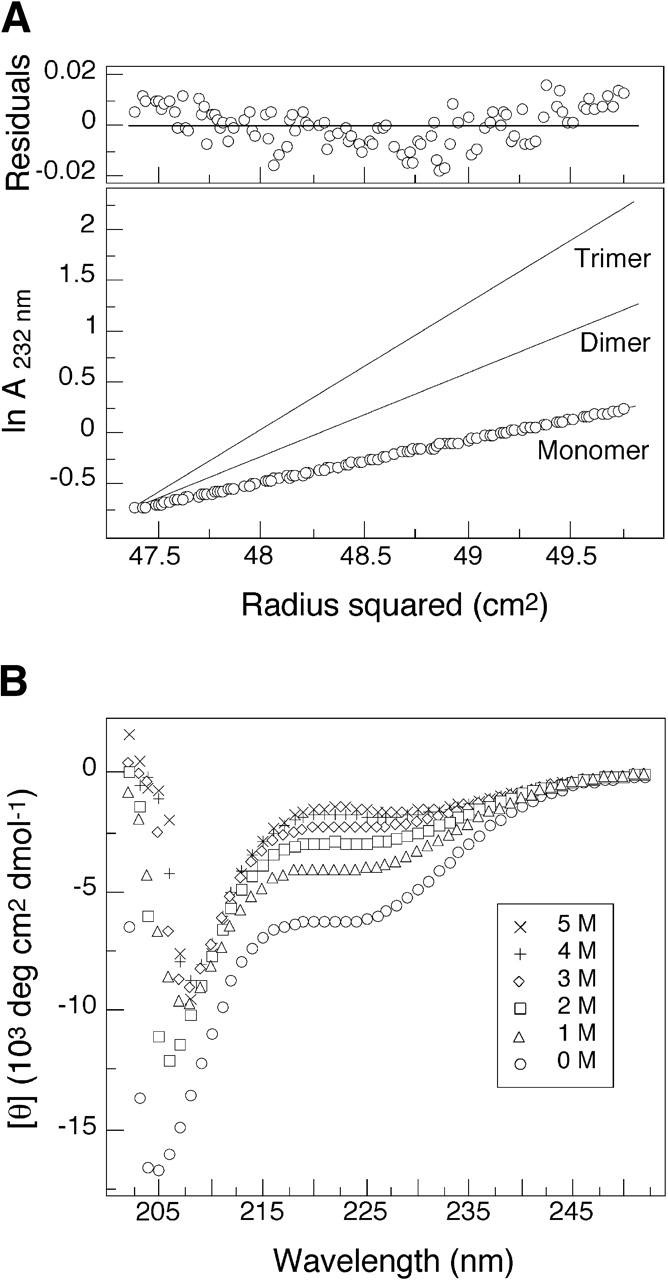
Ala-14 is largely unfolded in solution. (A) Representative sedimentation equilibrium data (34 krpm) of Ala-14 collected at 4°C in 50 mM sodium phosphate (pH 5.8) in ~6 mg mL−1 protein concentration. The natural logarithm of the absorbance at 232 nm is plotted against the square of the radial position. Lines indicate the expected slopes for monomeric, dimeric, and trimeric states. The random distribution of residuals indicates that the data fit well to an ideal single-species model. (B) Circular dichroism spectra of a 10 mg mL−1 solution of Ala-14 in PBS (pH 7.0) and 0°C as a function of GdmCl concentration.