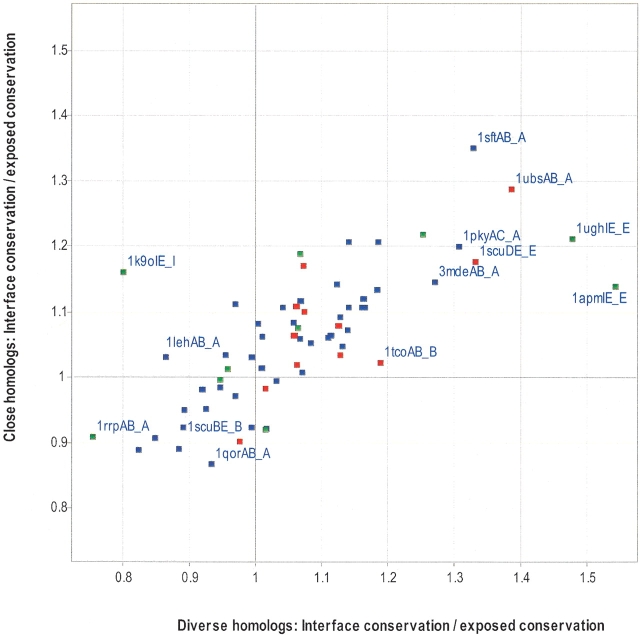
Figure 1.
Comparison of interface conservation with exposed noninterface conservation. The average conservation (IS; see Materials and Methods) was calculated for all interface residues and divided by the average conservation (IS) for all residues that were solvent exposed, but not part of the interface residues, using MSAs of close homologs or diverse homologs. A value of 1 or greater indicates that the protein interface is more conserved than the rest of the interface. Each data point represents one chain of a protein–protein complex, in which heterodimers are red, homodimers are blue, and transient complexes are green. Selected data points are labeled with the codes that appear in Table 1.

