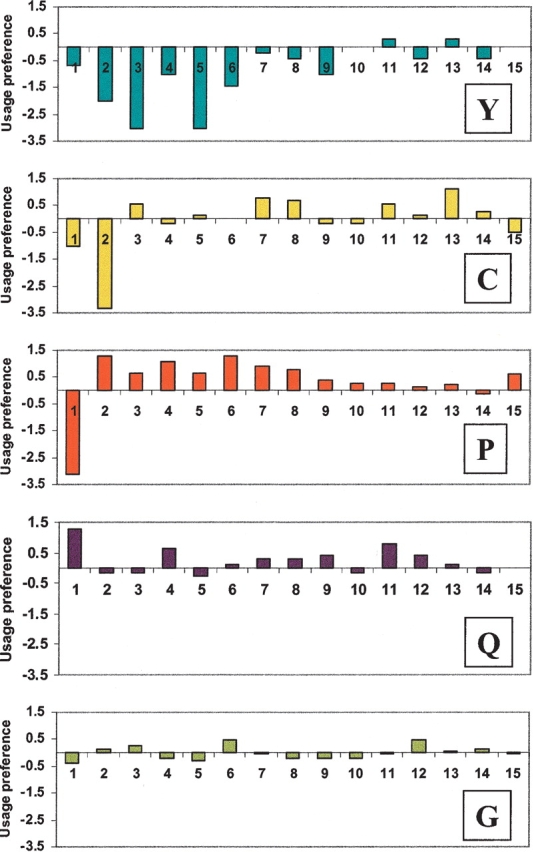
Figure 2.

Amino acid usage patterns at the N-terminal positions of mature proteins. The X-axis indicates the amino acid positions relative to the signal peptide cleavage site. The Y-axis indicates the usage preference, measured by the base 2 log ratios of observed and expected frequencies, where the expected frequencies were determined by examining all residues of all the mature proteins in the data set.
