
Figure 4.
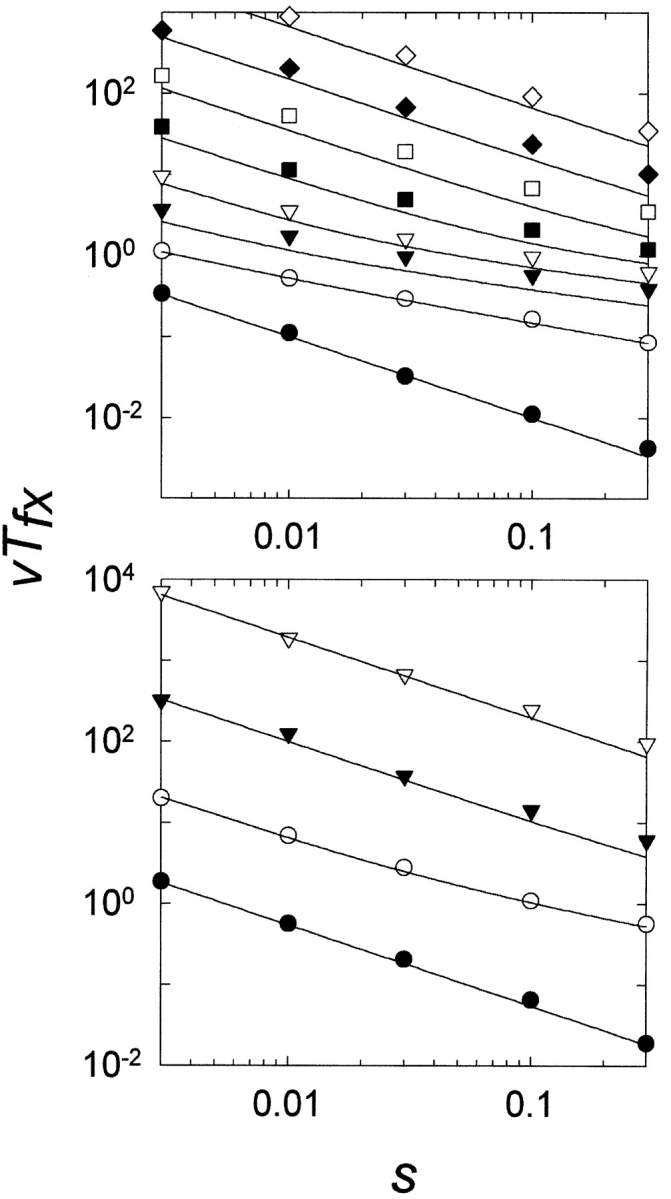
Normalized time (generations) to fixation (vTfx) versus the selection coefficient s. In all cases, the curves are determined from equation 4. Reproduction was stochastic. N =1000; v =0.01–0.0001. Each point is the average of 100 repetitions. (Top) ρ=1. Filled circles, λ =1; open circles, λ =2; filled inverted triangles, λ =3; open inverted triangles circles, λ =4; filled squares, λ =5; open squares, λ =6; filled diamonds, λ =7; open diamonds, λ =8. (Bottom) ρ=10. Filled circles, λ =1; open circles, λ =2; filled inverted triangles, λ =3; open inverted triangles, λ =4.