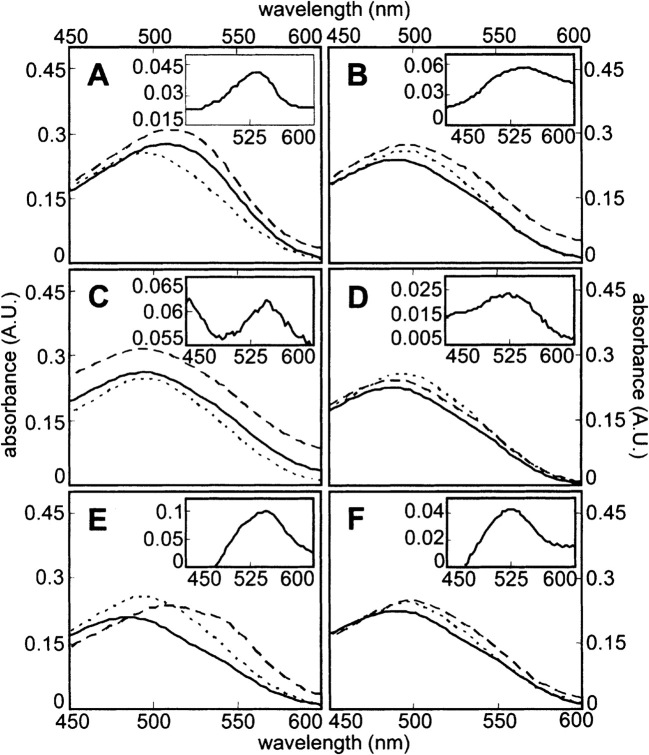
Figure 5.
Spectral shifts induced in CR by sonicated proteins. CR absorbance spectra acquired with a 0.3-cm path length cuvette are shown for solutions with no added protein (•••) and solutions containing native (———) or sonicated (– – –) protein at 1 mg/mL. Insets show difference spectra obtained by subtracting the spectra of native protein solutions from those of sonicated protein solutions. (A) BSA. (B) Myoglobin. (C) Lysozyme. (D) Tm0979. (E) Hisactophilin. (F) SOD.

