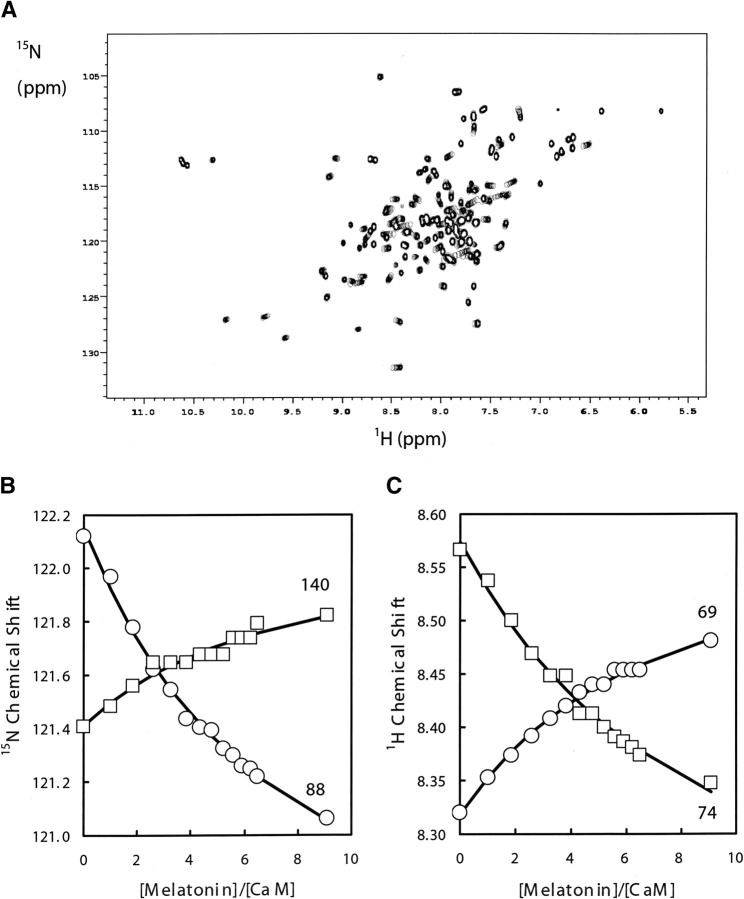
Figure 3.
(A) Superposition of portions of 2D 15N-1H HSQC spectra at different melatonin additions showing the progressive shift of the HN signals with increasing melatonin concentration. (B) Melatonin titration plots at 35°C monitored by 15N chemical shifts for residues Glu 140 and Ala 88. (C) Melatonin titration plots at 35°C monitored by 1H chemical shifts for residues Leu 69 and Arg 74.

