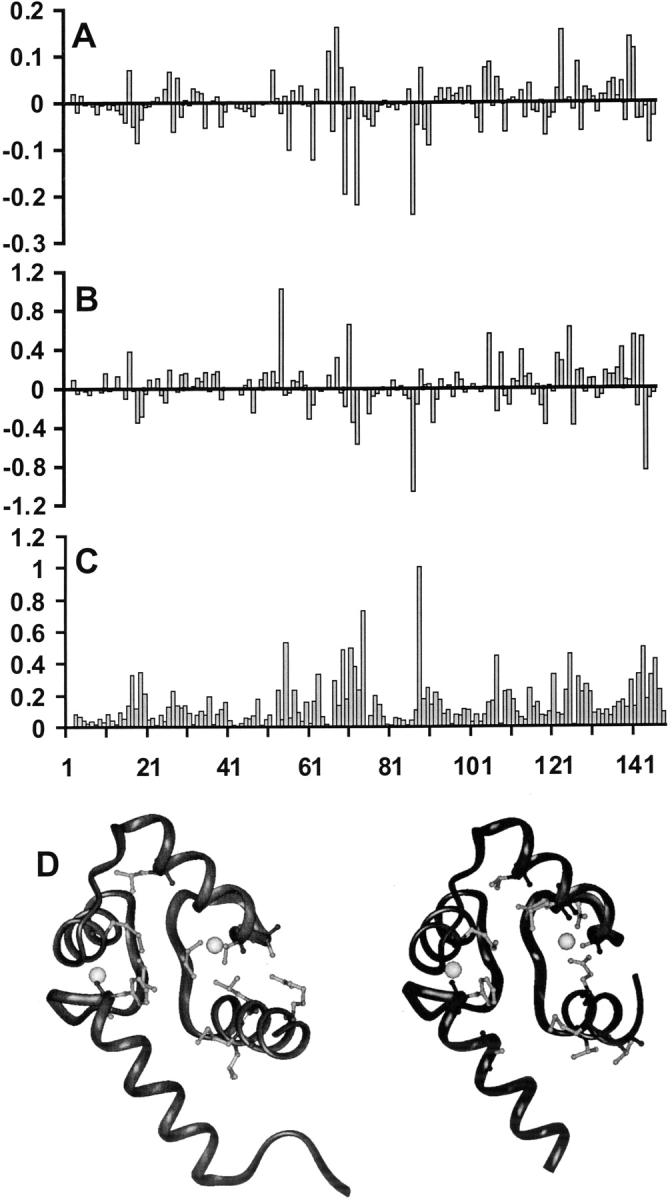
Figure 4.

Plots of the change of (A) 1H and (B) 15N chemical shift for the HN signals occurring upon complexation of CaM with melatonin as a function of residue number. Graph (C) presents a normalized weighed average, [WA], over the chemical shift changes of both 1H and 15N, using the formula [WA] = Σ|δCaM-Mel – δCaM|/2|Δmax|, where δCaM-Mel and δCaM are the chemical shifts observed in the complex and in free CaM, and Δmax is the largest chemical shift change observed for each type of nucleus. The bottom figure (D) shows the mapping of the chemical shift changes onto the structure of CaM (PDB: 4CLN) for N-domain (left panel) and C-domain (right panel). The amino acids that have the larger chemical shift upon melatonin binding are shown with a light gray ball-and-stick model. The Ca2+ ions are represented as spheres.
