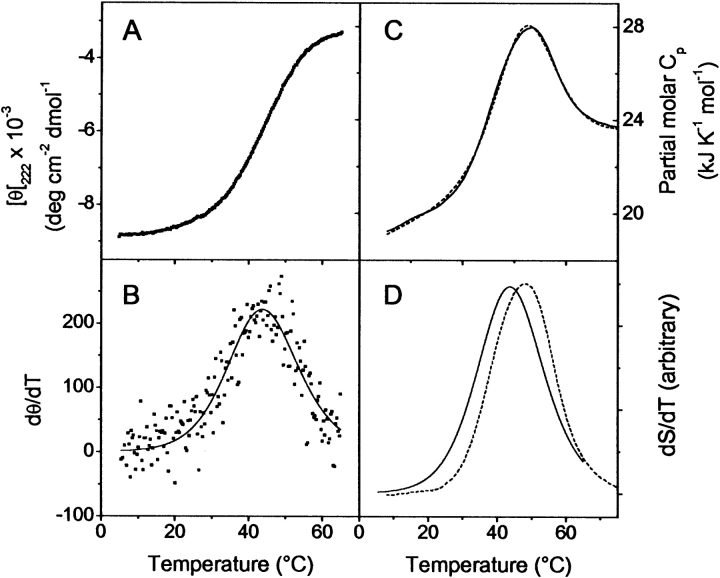
Figure 2.
Thermal melting of E1_5 at pH 7.0, followed by CD spectroscopy and DSC. Temperature-induced changes in MRE222 are shown in A. Protein concentration was 30 μM. (B) The same data in the derivative mode (symbols). The best fit according to equations 1–3 with Tm = 44.2°C and ΔHvH,CD = 130 ± 10 kJ mole−1 is visualized by the continuous line. (C) Partial molar heat capacity changes upon heating at 1° min−1. Protein concentration was 150 μM. The experimental data are shown as a continuous line. The broken line is the best fit for a two-state unfolding model determined with Tm = 48°C, ΔHfit = 136 ± 5 kJ mole−1 and ΔCp = 2.0 ± 0.2 kJ K−1 mole−1. (D) Superposition of the excess heat capacity obtained by calorimetry (dashed line) and the temperature derivative of MRE222 (continuous line) is shown. To facilitate the comparison, both functions were arbitrarily scaled.

