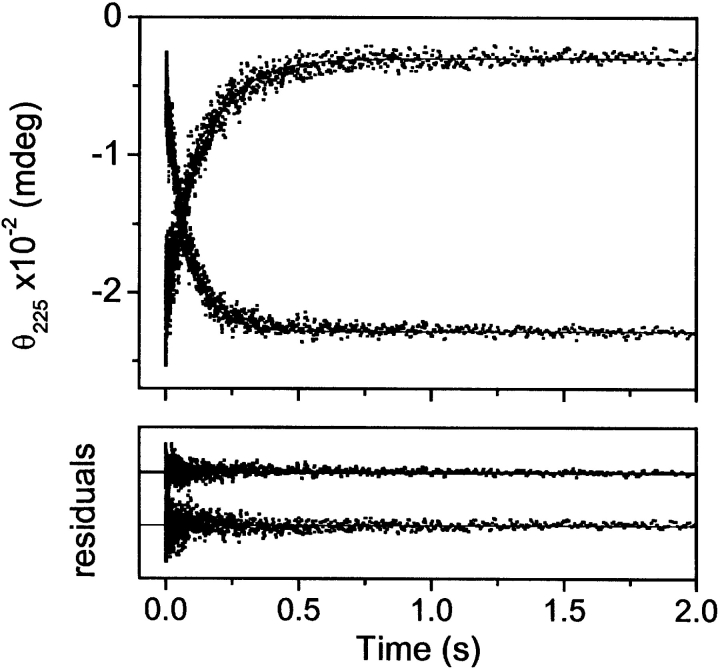
Figure 4.
Representative kinetic traces describing refolding and unfolding of E1_5 at 5°C followed by CD stopped-flow. The lines are best fits according to a single exponential function. The residuals of the fits are shown in the lower panels. Final protein concentration was 25 μM. Final urea concentration was 0.45 M for refolding (downward trace) and 5.3 M for unfolding (upward trace), respectively.

