
Figure 7.
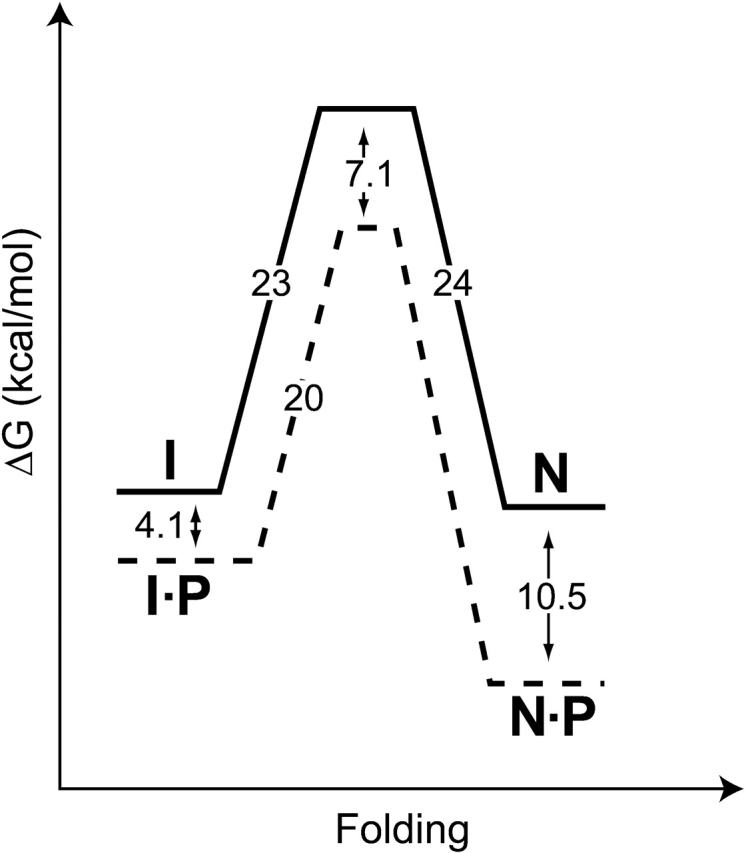
SGPB folding free energy landscape at 0°C. Solid lines depict the free energies of activation for SGPB folding and unfolding (from Fig. 4B,C ▶). Dashed lines illustrate the effect of ProSGPB (P) on the free energy profile (from Figs. 3C ▶, 4A ▶). Unlike αLP, the SGPB native state (N) is marginally stable compared to its intermediate state (I). Free energies of activation were calculated from folding and unfolding rates using transition state theory (Glasstone et al. 1941). Pro region binding to the native state was measured at 25°C.