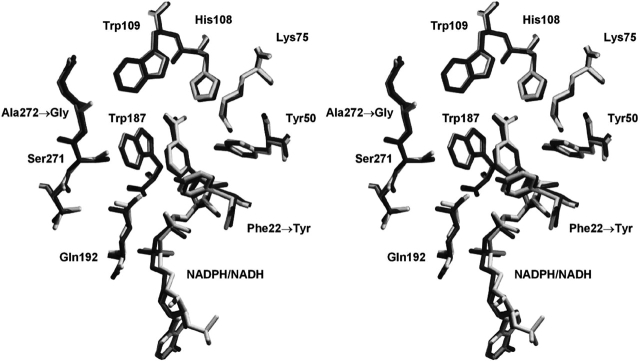
Figure 2.
Relaxed stereo diagram of the overlay of F22Y/K232G/R238H/A272G 2,5-DKGRA (dark gray) with wild type (1A80; light gray). The view is oriented toward the substrate-binding pocket (Khurana et al. 1998, 2000) and provides structural details of the region involving the F22Y and A272G mutations. The orientation of the NAD(P)H cofactor is identical to Figure 1 ▶.

