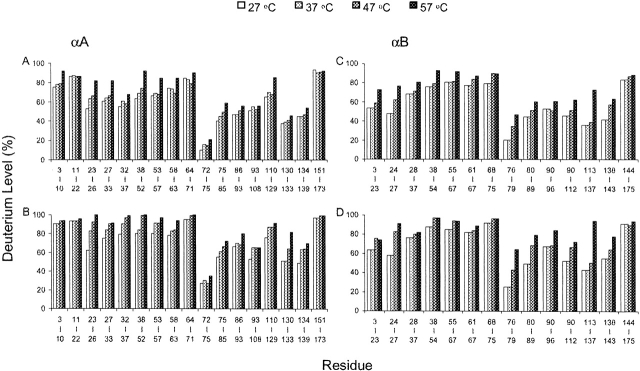
Figure 6.
Deuterium levels found in peptic fragments of α-crystallin following exposure of the intact protein to D2O at different temperatures for different times. (A) αA-Crystallin, short (t1) exposure time. (B) αA-Crystallin, long (t5) exposure time. (C) αB-Crystallin, short (t1) exposure time. (D) αB-Crystallin, long (t5) exposure time. The exposure time used for each temperature was adjusted to compensate for the temperature dependence of the rate of intrinsic hydrogen exchange (see Table 1).

