
Figure 1.
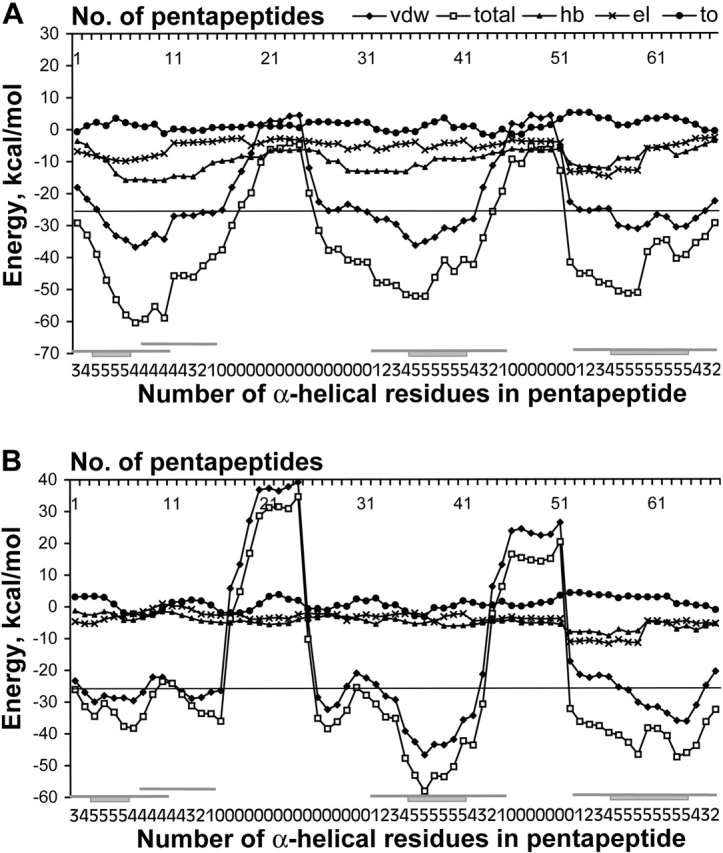
Total and all components energy profiles for α-helical model of cytochrome (PDB code 1c75). (A) Profiles are calculated for the standard stereochemistry of residues. (B) Profiles are calculated for the native stereochemistry of residues. Designations of energy terms are as follows: (total) total energy; (vdw) van der Waals energy; (hb) energy of hydrogen bonding; (el) energy of electrostatic interactions; (to) torsion energy. Along the axis of pentapeptide each point, i corresponds to the energy calculated for a pentapeptide fragment comprising residues i to i+4. The line for prediction of α-helices is drawn at −26 kcal/mole (see section “Choice of energy threshold” in Results and Discussion). Designations of regions of α-helices in the native protein are beneath the graph and are as follows. For each pentapeptide fragment, a number of residues that are α-helical in the native structure of the protein is indicated. Rectangle and adjunct lines denote, respectively, the wholly α-helical pentapeptides and the pentapeptides, including at least one α-helical residue in accordance with the native structure of the protein.