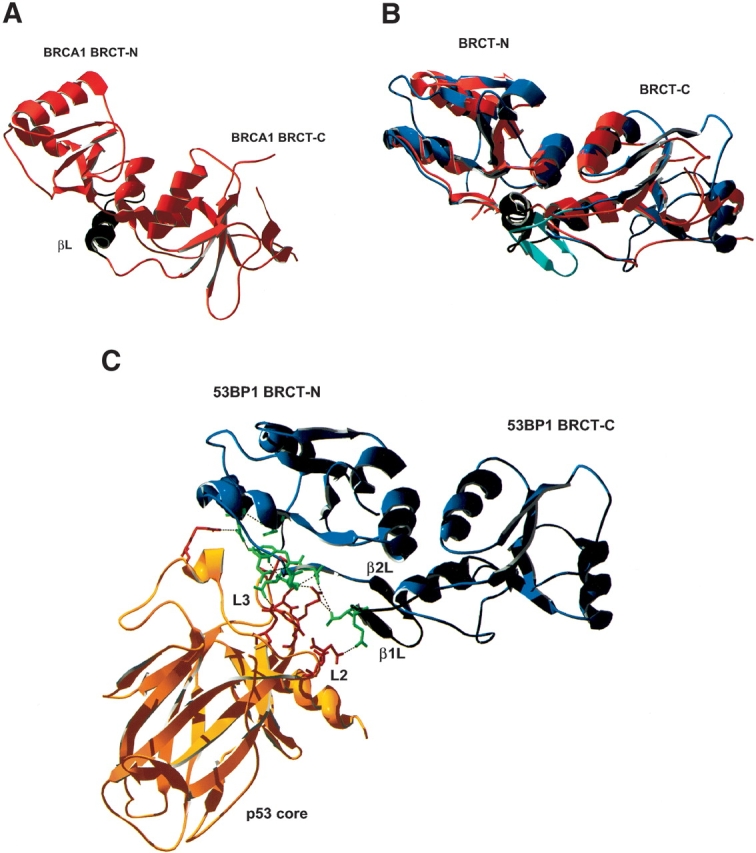
Figure 1.

Schematic representation of the structures of the BRCT domains of BRCA1 and 53BP1. (A) BRCA1-BRCT with the linker region in black. (B) An overlay of the BRCT domains of BRCA1 (red) and 53BP1 (blue); the linker regions are shown in black and in turquoise, respectively. (C) 53BP1-BRCT (blue) bound to p53 core domain (yellow). The binding interface is concentrated on the L2 and L3 loops of p53, which interacts with the C terminus of the BRCT-N and the linker region of 53BP1. Interacting residues are shown in green (53BP1) and in red (p53).
