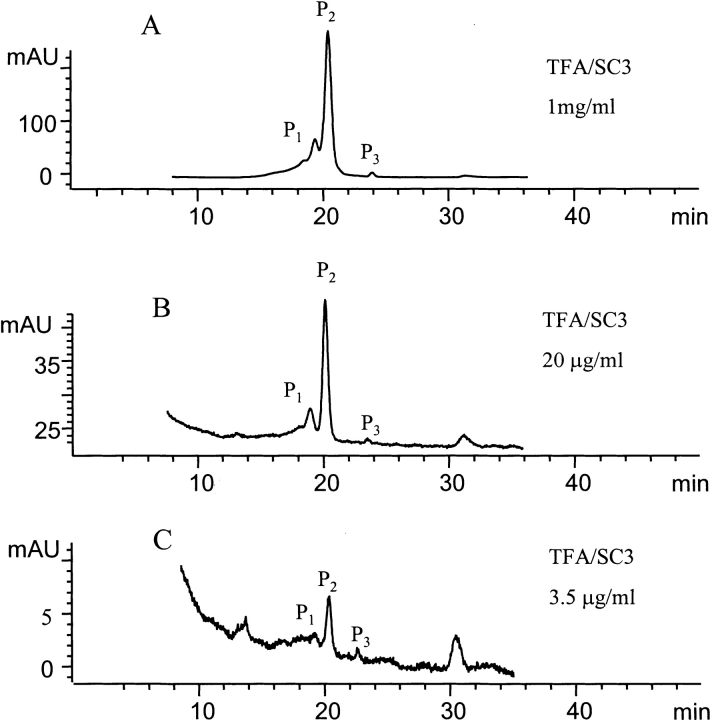
Figure 5.
SEC analysis of protein concentration–dependent oligomerization. (A) A 0.2-mL sample of soluble-state SC3 in 50 mM sodium phosphate (pH 7.0), at a concentration of 1 mg/mL was loaded onto the column. The peak areas of P1, P2, and P3 were integrated to be 45.9, 207.8, and 2.8 AU, respectively, yielding the ratio of 17.9 : 81 : 1.1. (B) The same sample as in A but diluted to 20 μg/mL with the same buffer before being loaded onto the column; 0.2-mL sample was loaded. The peak areas of P1, P2, and P3 were integrated to be 0.503, 3.263, and 0.033 AU, respectively, yielding the ratio of 13.2 : 85.9 : 0.9. (C) The same sample as in A but diluted to 3.5 μg/mL with the same buffer before being loaded onto the column; 0.2-mL sample was loaded. The peak areas of P1, P2, and P3 were integrated to be 0.0095, 0.1028, and 0.0075 AU, respectively, yielding the ratio of 7.9 : 85.8 : 6.3.

