Figure 7.
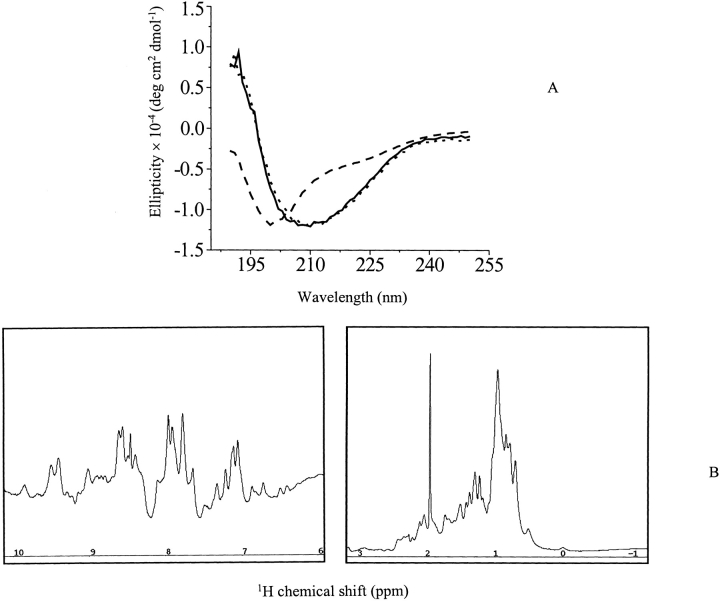
Structure determination of P2, dimeric SC3. (A) CD spectra of dimeric SC3. The measurement was done at 4°C in the presence of 50 mM sodium phosphate (pH 7.0). Solid line indicates unchromatographed SC3; dotted line, dimeric SC3 collected from the gel filtration column; and dashed line, performic acid oxidized SC3. (B) One-dimensional 1H NMR spectrum of dimeric SC3. The sample in 50 mM sodium phosphate (pH 7.0) after gel filtration was concentrated four times at 4°C. The measurement was done for >15 h at 4°C.

