Figure 2.
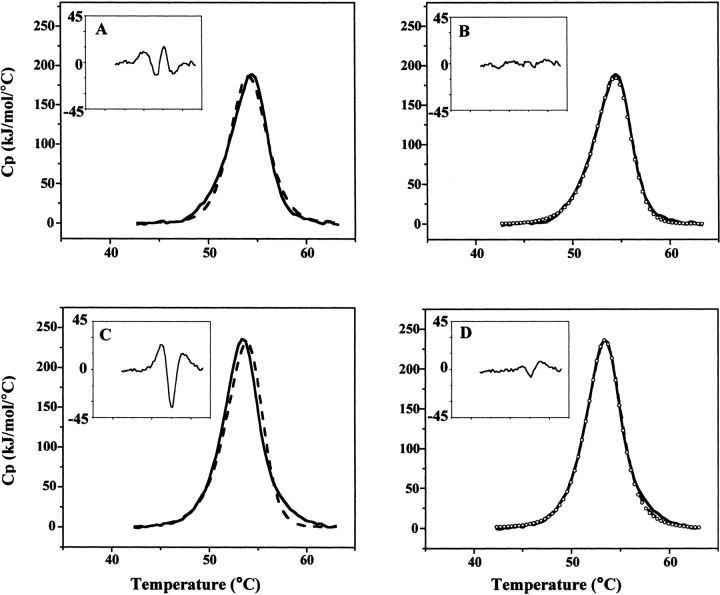
DSC curve fitting of NAD+ synthetase thermal unfolding. (A,B) DSC scan of NAD synthetase (0.8 mg/mL) in 60 mM EPPS (pH 8.5), 20 mM KCl, 19 mM NH4Cl, 10 mM MgCl2. Scan rate: 1.5°C/min. (A) The DSC data (solid line) is shown in comparison to the fit to a two-state model (dashed line). (Inset) Residual errors in excess heat capacity for the two-state fit of the DSC data. (B) The DSC data (solid line) is shown in comparison to the fit to a two-state dissociative model, using the entire DSC data (dashed line). Circles represent the fit of the first half of the DSC data (up to T1/2). (Inset) Residual errors in excess heat capacity for the two-state with dissociation fit of the DSC data. (C,D) DSC scan of NAD+ synthetase (0.9 mg/mL) in 60 mM EPPS (pH 8.5), 20 mM KCl, 19 mM NH4Cl, 10 mM MgCl2, 2.5% (v/v) DMSO. Scan rate: 1.5°C/min. (C) The DSC data (solid line) is shown in comparison to the fit to a two-state dissociative model (dashed line). (Inset) Residual errors in excess heat capacity for the two-state dissociative fit of the DSC data. (D) The DSC data (solid line) is shown in comparison to the fit to a sequential three-state model using the entire DSC data (dashed line). Circles represent the fit of the first half of the DSC data. (Inset) Residual errors in excess heat capacity for the sequential three-state fit of the DSC data.

