
Figure 6.
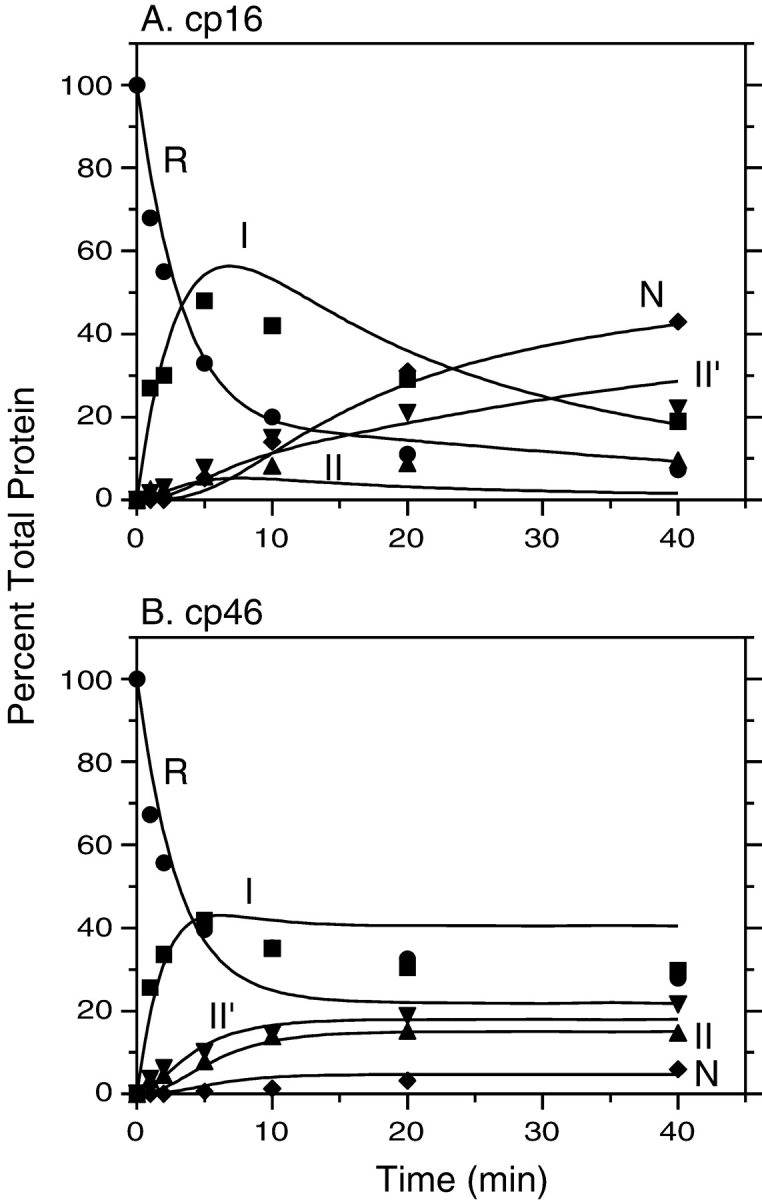
Kinetics of disulfide-coupled folding of cp16 (A) and cp46 (B) BPTI. The fully reduced proteins were incubated in the presence of 80 mM DTTSS at pH 8.7, 25°C, and progress of the reactions was monitored by gel electrophoresis as described in the legends of Figs. 4 ▶ and 5 ▶. The filled symbols represent the relative intensities of the bands identified with the various species defined in Scheme 1 ▶: R (circles), I (squares), II (triangles), II′ (down triangles), and N (diamonds). The curves represent the values calculated by numerical integration of the kinetic scheme using the rate constants listed in Table 1.