
Figure 7.
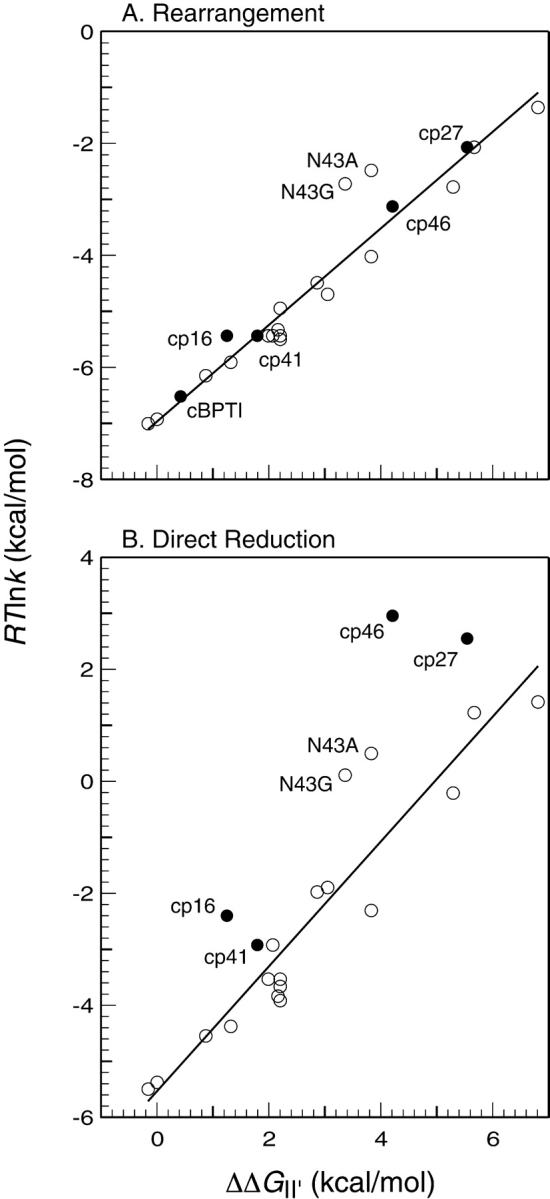
Correlations between the rates of (A) intramolecular rearrangement or (B) direct reduction of II′ and the destabilization of this species with respect to the fully reduced and unfolded protein. The rate constants are expressed as RTln(k), which is related to the free energy difference between II ′ and the corresponding transition state by a constant of addition. The filled symbols represent the rate constants for the circular and circularly permuted proteins, and the open symbols represent the previously Zhang and Goldenberg 1997b; Bulaj and Goldenberg 2001a). The lines shown were fit to the data for the replacement mutants by the method of least squares. For k−rearr′, R2 = 0.95 and the slope is 0.86; for k−dir′, R2 = 0.93, and the slope is 1.1.