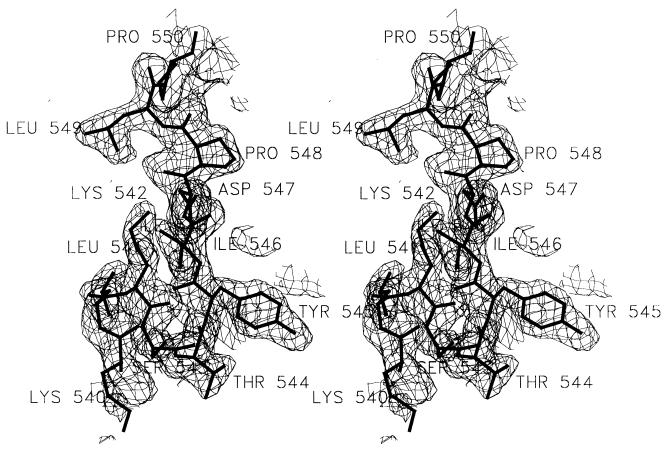
Figure 1.
Electron density map with refined model superimposed. Shown is a stereo representation of a 2Fo − Fc map, contoured at 1.1 σ. Phases were generated by removing residues 520–560 in TaqP and refining the structure for 40 cycles with tight geometric restraints. Final refined model for residues 540–550 in TaqP is superimposed. All residues are labeled. The figure was made by using setor (47).

