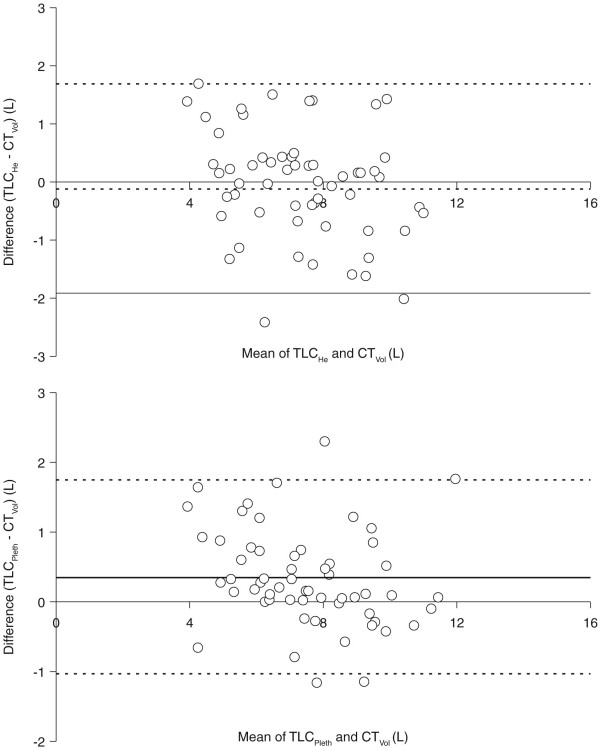
Figure 3.
Bland-Altman plots indicating difference between (A) total lung capacity measured by helium dilution (TLCHe) and inspiratory lung volume achieved during scan acquisition (CTVol), and (B) total lung capacity measured by body plethysmography (TLCPleth) and CTVol. Continuous line represents mean difference and dashed lines represent mean difference +/- 2 standard deviations.

