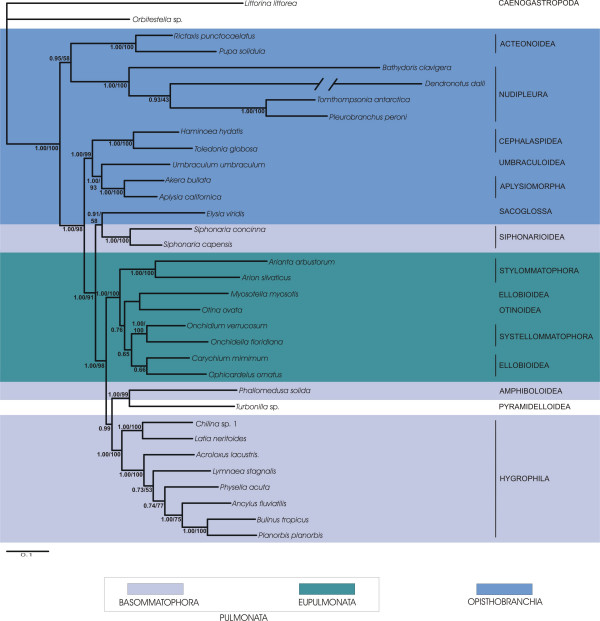
Figure 3.
Bayesian inference phylogram of euthyneuran relationships (reduced taxon set). We used concatenated sequences of 18S rRNA, 28S rRNA, 16S rRNA and COI DNA. 50% majority rule consensus tree. Posterior probabilities and bootstrap support of Maximum Likelihood analysis provided at the branches. Taxonomic classification follows Bouchet et al. [38]. Euthyneuran taxa are marked by colour frames.

