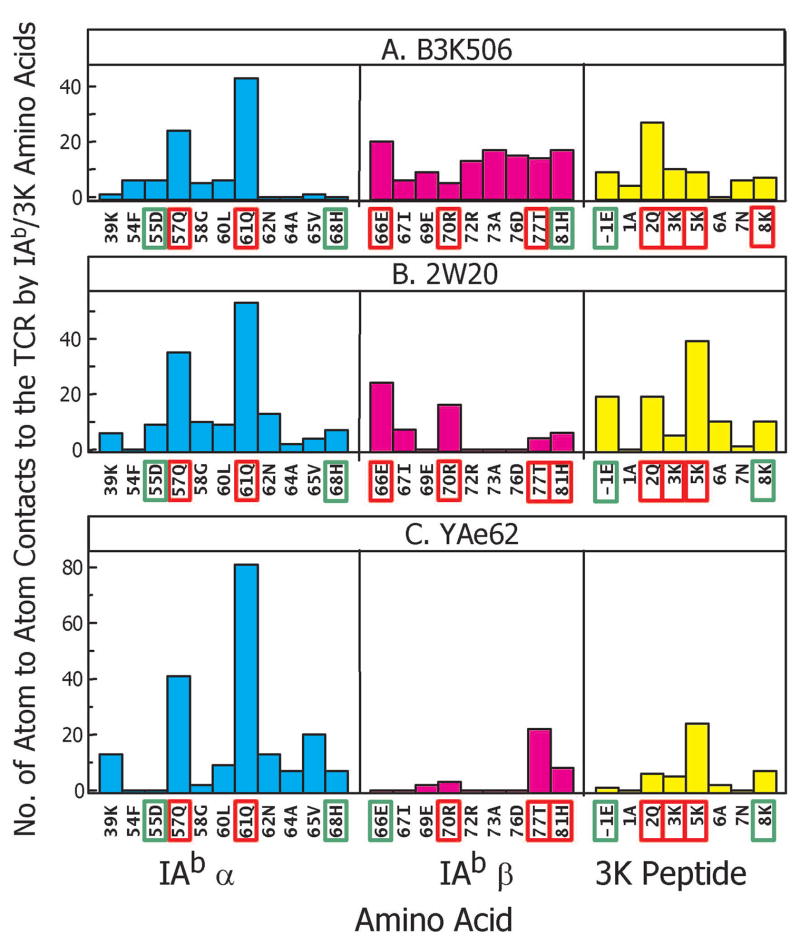
Figure 3. IAb/3K atom to atom contacts with the TCRs and the correlation with IAb/3K mutational data.
The figure shows the number of atom to atom contacts between the A) B3K506, B) 2W20 or C) YAe62 TCR and individual IAb/3K amino acids within the α chain (cyan), β chain (magenta) and peptide (yellow) portion of the ligand. Data are shown for all IAb/3K amino acids that contact the TCR in any of the structures. The IAb/3K non-alanine amino acids that were previously (Huseby et al., 2006) subjected to mutational analysis are high-lighted with a rectangle. A green rectangle indicates that when this position was mutated to alanine and tested for TCR binding there was an increase in ΔΔG of ≤ 0.8 kcal/mole. A red rectangle indicates an increase of >0.8 kcal/mole.

