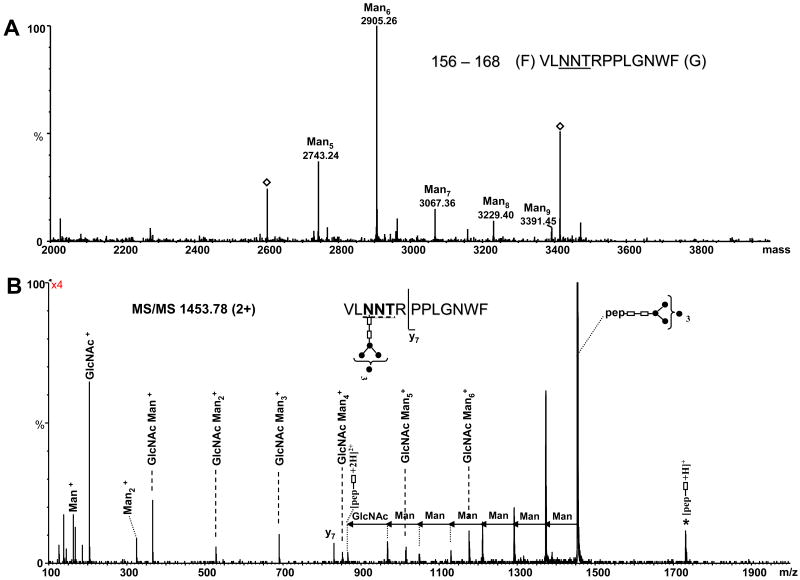
Figure 3.
(A) Deconvoluted mass spectrum over the mass range 2000–4000, showing the glycopeptides with the amino acid sequence 156–168 and high mannose glycans with composition from Man5 to Man9. The masses indicated by an empty diamond could not be identified. (B) MS/MS of the precursor ion m/z of 1453.78 (2+) corresponding to the chymotryptic peptide 156–168 containing the Man6 glycan at position N158 (N540). The glycopeptide carrying the glycan is indicated at the top (right) and the consensus sequence is underlined. The mass differences of 81 and 101.5 amu between doubly charged fragment ions indicate loss of mannose and N-acetyl glucosamine, respectively. For a better illustration, the tandem mass spectrum was multiplied by four. Filled circles represent Man residues; empty rectangles represent GlcNAc. The MS/MS spectra are presented in raw format, because in this manner they are illustrative for the different fragmentation pathways observed for the described glycopeptides. The number in the bracket indicates the number of Man residues attached to the trimannosyl chitobiose core. The star denotes singly charged glycosylated ions fragment ions derived from the precursor by fragmentation of the glycan and charge reduction.

