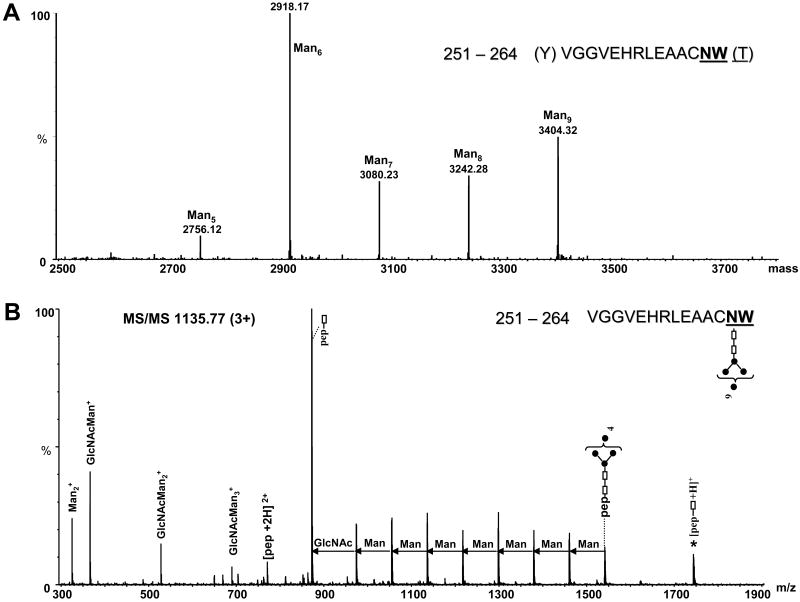
Figure 5.
(A) Deconvoluted mass spectrum over the mass range 2500–4000, showing the glycopeptides with the amino acid sequence 251–264 containing high mannose glycans with composition from Man5 to Man9. (B) MS/MS of the precursor ion m/z 1135.77 (3+) corresponding to chymotryptic glycopeptide 251–264 containing the Man9 glycan at position N263 (N645). The amino acid sequence of the glycopeptide and the structure of the glycan are indicated at the top (right). The successive mass difference of 81 amu between doubly charged fragment ions is indicative for a high mannose glycan. Filled circles represent Man residues; empty rectangles represent GlcNAc. The number in the bracket represents maximum of Man residues attached to the glycosylation site. The star denotes singly charged ions formed by fragmentation of the glycan and charge reduction of the precursor ion.

